
Technological Infrastructure Behind Real-Time Sports Tracking and Statistics
What the data pipeline actually does
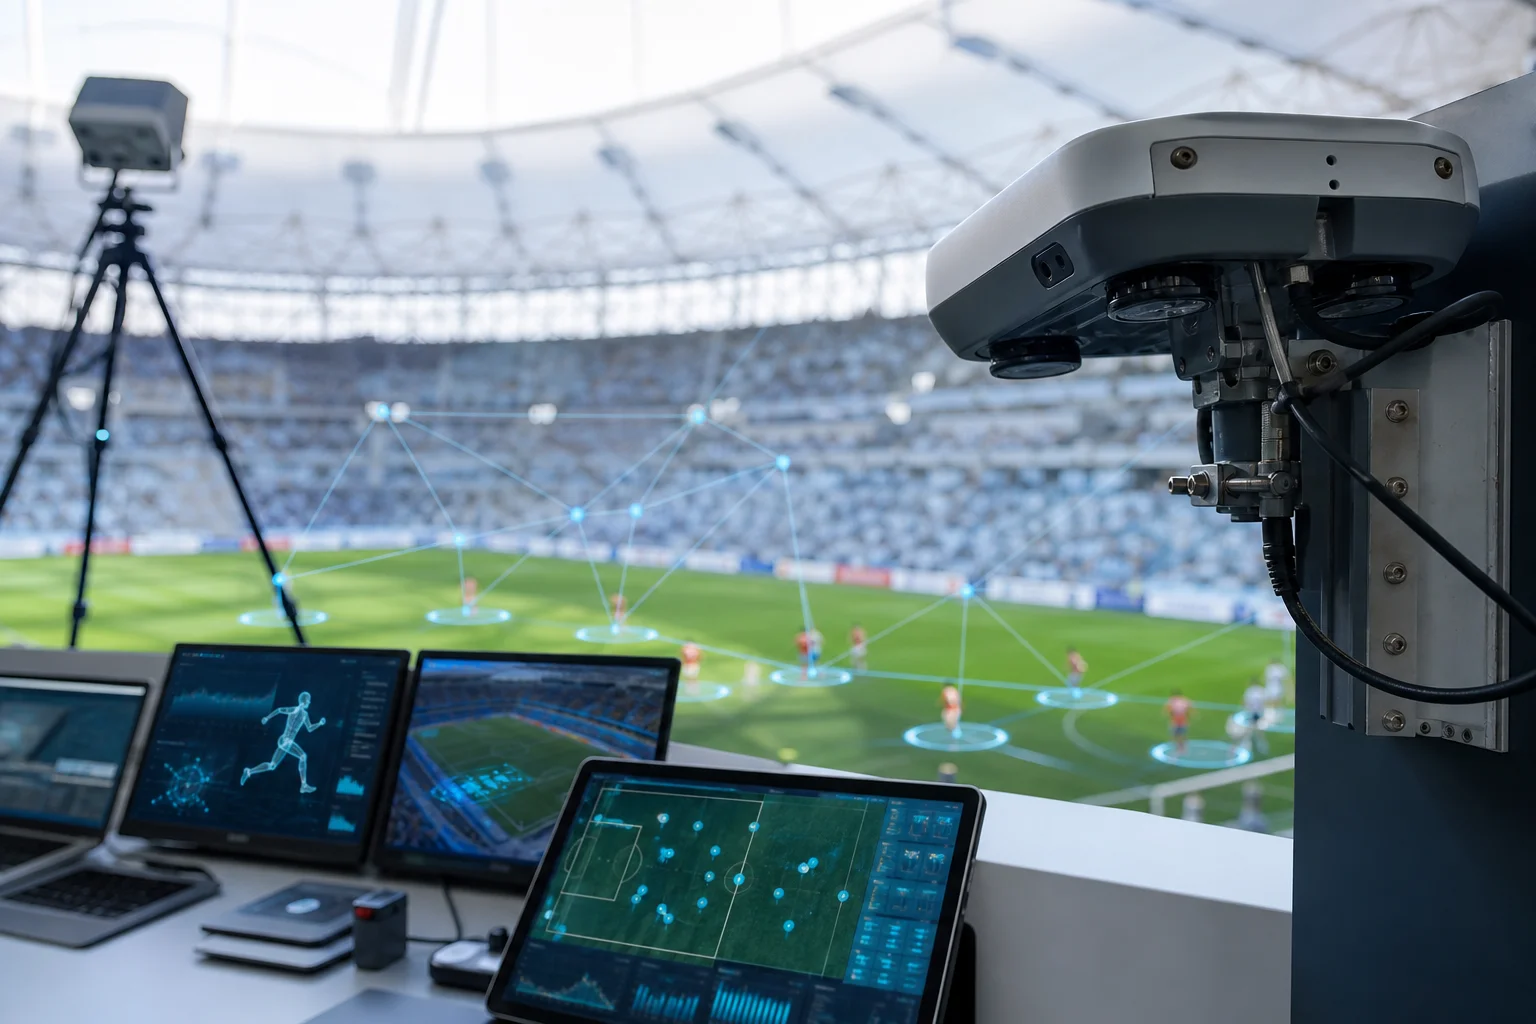
A live scoreboard number is the final link in a chain that begins with a moving body. The technological infrastructure behind real-time sports tracking and statistics spans four layers: capture (optical cameras, wearable inertial sensors, UWB anchors), transport (fibre, Wi-Fi 6E, private 5G), processing (edge servers running detection and sensor-fusion models) and delivery (REST APIs, WebSocket streams, broadcast graphics engines). Every layer adds delay and its own failure mode. A camera rig running at 25 frames per second emits a frame every 40 ms; an inertial unit sampling at 100 Hz emits data faster but noisier. Fusion code reconciles both into one coordinate per athlete per tick. Teams that map this chain before purchasing hardware avoid the common trap of optimising the visible layer — the app — while the invisible layers drift out of alignment.
Real-Time Sports Tracking Infrastructure
-
Capture data at the edge
Optical cameras, wearable inertial sensors, and UWB anchors record player and ball movements. Each device generates high-frequency raw coordinates with strict sampling rates.
-
Transport feeds via low-latency networks
Data moves from the venue floor through fibre-optic cables, Wi-Fi 6E, and private 5G networks. Transport protocols must survive high interference and maintain minimal jitter.
-
Synchronize stadium clocks precisely
Network Time Protocol and PTP align timestamps across disparate edge devices. Frame-accurate synchronization prevents spatial discrepancies during fast multi-camera tracking.
-
Process sensor fusion at edge servers
Local edge servers run detection and sensor-fusion models to clean raw coordinates. This layer resolves occlusions and calculates immediate physical positioning without cloud roundtrips.
-
Convert coordinates into live statistics
Algorithms analyze positional streams to generate advanced metrics like speed, distance, and possession. Raw spatial data transforms into actionable sports statistics instantly.
-
Deliver feeds to broadcasters and bettors
WebSocket streams and REST APIs push finalized statistics to broadcast graphics engines and betting platforms. Every millisecond in this final delivery layer impacts the viewer experience.
Sensors at the edge of play
Capture hardware divides into three families, and most elite venues run at least two of them. Optical systems such as Hawk-Eye and Second Spectrum deploy eight to sixteen calibrated cameras, extract skeletons with pose-estimation networks and triangulate positions in 3D; they deliver clean ball and player coordinates but depend on sightlines, lighting and camera placement. Wearable units from Catapult or STATSports combine GNSS at roughly 10 Hz with accelerometers and gyroscopes at 100 Hz, capturing load, sprint mechanics and heart rate that cameras cannot see. Radio frequency anchors — UWB for indoor courts, RFID for puck and ball timing — provide low-latency triggers at the cost of anchor geometry and interference management. Each family fails differently, which is why serious deployments overlap them and continuously cross-check one stream against another.
Latency budgets and why milliseconds matter
Latency is not one number but a budget split across the chain, and it is the most honest measure of the technological infrastructure behind real-time sports tracking and statistics. Capture to edge ingest typically costs 20–50 ms; detection and fusion another 10–30 ms; transport to the consumer between 30 and 100 ms; rendering one to three frames, or 16–100 ms. A 25 fps optical pipeline alone spends 40 ms per frame, so asking for 50 fps tracking is a hardware decision, not a software setting. In-venue displays and courtside tablets usually target under a second end to end, while remote streaming through segmented protocols such as HLS can add several seconds of buffering by design. Trading desks and live data resellers demand the tightest windows, and several regulators impose latency controls to stop feeds becoming a predictive edge. Measure each hop separately and alert when any segment crosses its threshold.
Core Components of Real-Time Sports Tracking
| Infrastructure Layer | Key Operational Requirement |
|---|---|
| Capture and Edge Sensors | Optical cameras and wearable UWB anchors |
| Transport and Network | Low-latency fibre and private 5G networks |
| Data Processing and Fusion | Edge servers running real-time detection models |
| Delivery and Distribution | WebSocket streams and broadcast graphics engines |
| Synchronization and Timing | Precise clock synchronization across the stadium |
Synchronizing clocks across a stadium
Fusion only works when every sample carries an honest timestamp. A camera frame, an inertial reading and a UWB ping taken at the same instant must be aligned to well under a millisecond, otherwise derived velocity and acceleration turn into noise. IEEE 1588 Precision Time Protocol over the venue network, disciplined by a GNSS receiver, gives switches and edge servers a shared reference; consumer-grade NTP is far too coarse for this job. Timestamp at the source rather than at the gateway, and log the estimated offset alongside every record so analysts can replay flawed windows honestly. Drift is the quiet enemy: a rack that free-runs for a week can slip enough to smear sprint peaks and possession changes across frames. Grandmaster clocks, boundary clocks on switches and continuous offset monitoring cost far less than rebuilding a season of suspect data.
Where newcomers usually get it backwards
Here is the pattern I see most often, and it is entirely forgivable: a new team buys cameras, wires them into a workstation and immediately starts building dashboards or a machine-learning model. Three weeks later the numbers look wrong and nobody can say why. The order is usually inverted. Confirm first that clocks agree, that the pitch is calibrated and that raw coordinates map to the right player — then build analytics.
- Log raw frames with timestamps before applying any filter.
- Run a replay harness against known ground truth, such as manual video review of ten sprints.
- Time the whole path with a physical stopwatch test, not with internal counters.
A one-frame offset can manufacture impossible sprint speeds and phantom turnovers. Fixing that after models ship means retraining and re-explaining every metric to every coach. Start boring, stay honest, and the dashboards will hold up.
Core Mechanics of Real Time Sports Infrastructure
Data capture relies on edge sensors
Transport networks demand strict latency budgets
Edge servers handle sensor fusion
Delivery layers feed broadcasters and bettors
Turning coordinates into live statistics
Coordinates are raw material; statistics are inferences. The chain runs through multi-object tracking, where the Hungarian algorithm assigns detections to identities and a Kalman filter smooths each trajectory while preserving genuine acceleration. The event layer then watches for state changes — a pass when the ball leaves one player's possession radius toward a teammate, a shot when trajectory and speed cross thresholds near the goal frame. Aggregations such as possession share, distance covered in speed bands, expected goals and pressing intensity sit on top, each carrying its own assumptions. Confidence scores matter: a model that guesses an occluded player's position is not wrong, but the output should be labelled as estimated. Many providers route low-confidence events to human operators for review and push corrections within seconds, so one event stream serves live graphics and post-match analysis without diverging.
Edge, cloud, or both
Architecture choice usually comes down to where fusion happens. Running it at the edge, on rack servers inside the venue, keeps round-trip time low and survives a severed uplink; the trade-off is hardware on every site and remote maintenance. Centralising in a cloud region simplifies model updates and elastic scaling but adds a network hop that grows with distance and congestion. Most mature operators land on a hybrid: edge nodes fuse raw sensor streams, publish compact events to a message broker such as Kafka or MQTT, and cloud services handle fan-out, historical storage and model training. Hot state lives in Redis, live consumers connect through WebSockets, and a CDN absorbs the read amplification of a knockout final. Budget for egress and for failure drills — an offline buffer that replays after reconnection is worth more than another dashboard.
Feeds for broadcasters, bettors, venues
Downstream consumers do not want coordinates; they want contracts. A broadcaster needs graphics-ready events delivered a few frames after the action, a trading desk needs the same events with millisecond discipline and explicit correction semantics, and a venue app needs a friendly scoreboard that never flickers. Documenting tick rate, schema version, delivery guarantee and the meaning of a retraction belongs to the technological infrastructure behind real-time sports tracking and statistics — it is not paperwork bolted on afterwards. Run dual transport paths so a single fibre cut cannot silence the feed, and monitor integrity continuously: sudden latency shifts, duplicated event identifiers or gaps nobody can explain deserve investigation before they reach customers. Immutable audit logs let you reconstruct what a bettor or a broadcaster saw, and when. That traceability is what turns a clever demo into infrastructure people trust.