
How High-Speed Data Analytics Power Modern Competitive Sports Broadcasts
Latency Is the Real Scoreboard
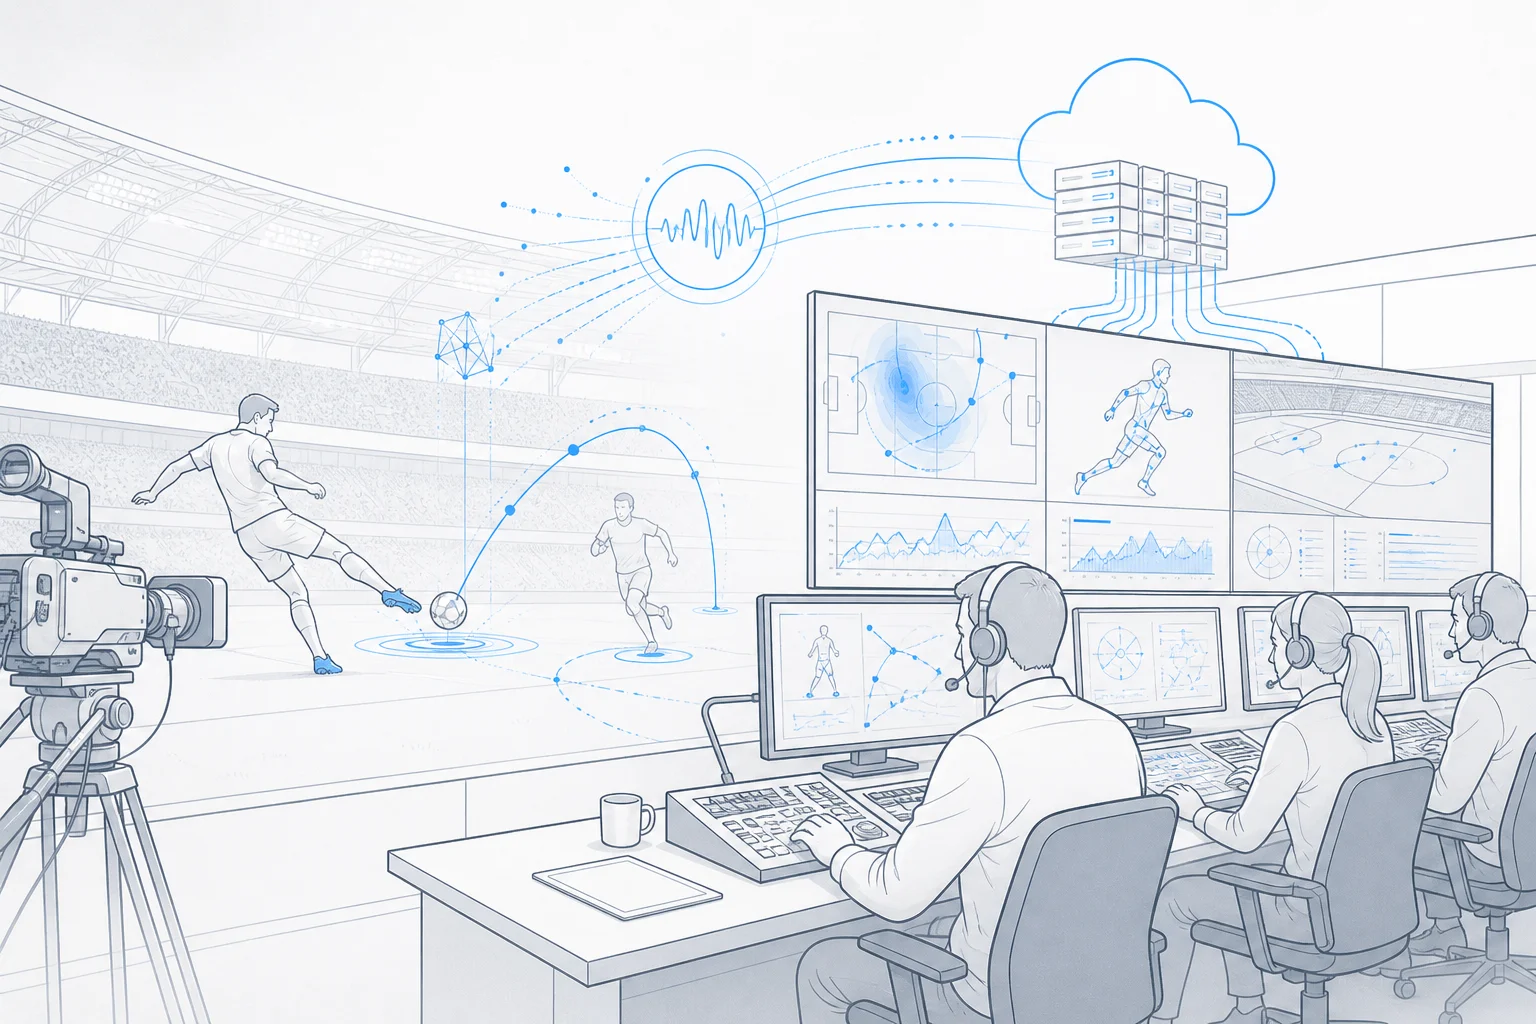
A live competitive sports broadcast is only as credible as its slowest technical link. The ingestion chain runs from optical capture and sensor triggers at the venue through transport, normalisation, complex graphics rendering, and final playout, with every hop adding measurable delay. Engineers calculate the latency budget in hundreds of milliseconds end-to-end, because an on-screen graphic that contradicts a replay the viewer has already consumed on social media destroys viewer trust faster than displaying no graphic at all. Precision time protocol (PTP) clocks, timestamped event messages, and a single authoritative clock source prevent the familiar failure of a win-probability stat card appearing two passes behind the live action. Edge computing at the venue or at a nearby point of presence shortens the critical round trip, while scalable cloud regions absorb heavier historical modelling. The ultimate engineering challenge is not peak data speed, but variance: a pipeline that is fast on average yet stalls for a second at a pivotal moment ruins the broadcast flow for both commentator and viewer.
Ingesting and Processing Live Broadcast Data
-
Capture optical and sensor data
Venue cameras, optical tracking systems, and player wearables record high-speed spatial metrics. Precision time protocol clocks timestamp every single event message to maintain strict chronological synchronization across feeds.
-
Manage the strict latency budget
Engineers monitor ingestion, normalisation, and transport hops to prevent delays. Controlling end-to-end latency ensures on-screen graphics match live action before viewers spot discrepancies on social media.
-
Render real-time on-air graphics
Complex analytics engines process raw telemetry feeds instantly to generate visual overlays. These data-driven graphics provide commentators and audiences with immediate tactical insights during live play.
-
Support officiating with metrics
High-speed analytical tools deliver precise positioning data to video assistant referees. Objective measurements help officials resolve disputed calls quickly and accurately during competitive matches.
-
Monitor integrity and betting markets
Automated analytical systems continuously scan live performance data against historical benchmarks. This detects unusual patterns instantly, protecting betting markets and maintaining competitive fairness.
Where High-Speed Analytics Change Commentary
The true payoff of a high-speed data pipeline is editorial enhancement rather than mere technical achievement. On-air analysts receive real-time win-probability curves, expected goals (xG), expected threat, momentum indices, and tactical packing rates while the passage of play is still under live review, allowing commentators to describe tactical intent instead of merely narrating visible outcomes. Automated event detection systems shave critical minutes off highlight clipping workflows, a necessity when rights holders push instant clips to digital and social platforms inside tightly defined windows. Second-screen companion applications, in-venue stadium displays, and international multi-language feeds all draw from the exact same normalised event stream. This is where the core value of how high-speed data analytics power modern competitive sports becomes visible to the audience: a graphic that decodes a complex tactical shift in three seconds carries far more value than a forty-page post-match report. Data provenance remains the anchor of credibility, as league-sanctioned providers publish rigorous event definitions and audit trails that withstand on-air scrutiny.
Sensors, Optical Tracking and Wearables
Two primary capture philosophies dominate modern competitive sports. Optical tracking systems deploy arrays of calibrated cameras and computer vision algorithms to derive precise player and ball coordinates dozens of times per second, with skeletal pose estimation running efficiently on commodity GPUs. Wearable systems rely on ultra-wideband (UWB) local positioning anchors and inertial measurement units (IMUs), producing higher sample rates for acceleration, deceleration, and physiological load metrics while requiring strict battery management and player consent compliance. Ball tracking operates as a specialised discipline, utilising high-frame-rate cameras and triangulation to feed definitive goal-line and boundary decisions. The resulting data volumes are massive: a single competitive match generates millions of positional rows that require automated cleaning, smoothing, and identity reconciliation when substitutions occur or players are obscured. Commercial providers such as Hawk-Eye, Second Spectrum, Genius Sports, Sportradar, Stats Perform, and Catapult occupy complementary niches, and modern broadcasters routinely integrate multiple sources to cross-verify every metric that reaches the air.
Technical Requirements for Sports Broadcast Analytics
| Broadcast Condition | Analytics Implementation |
|---|---|
| Latency budget management | Calculating delays in hundreds of milliseconds end-to-end |
| Clock synchronization | Using precision time protocol clocks and timestamped event messages |
| Data capture methods | Deploying optical tracking sensors and athlete wearables |
| Officiating support | Leaning on data feeds to review competitive rulings |
| Integrity monitoring | Watching betting markets for match manipulation risks |
From Raw Feed to On-Air Graphic
Between the raw sensor and the television screen sits a critical normalisation layer. Raw telemetry feeds arrive in disparate schemas, coordinate systems, and clock domains; a high-performance stream processor reconciles them into a canonical event model, attaches confidence scores, and publishes to a message bus that graphics, betting, editorial, and archive systems subscribe to independently. From there, templated graphics engines, augmented-reality renderers, and virtual-set tools pick up events and instantly trigger pre-built visual layouts. The paramount engineering constraint is determinism: the exact same event payload must produce the identical graphic every single time, backed by human override controls and a hot-standby render machine ready to take over mid-match. Latency budgets must be validated through synthetic event injection rather than theoretical assumption. Most failures traced back to graphics control rooms are not rendering bugs, but schema mismatches, dropped heartbeats, or clock drift that expose themselves only when teams are on the pitch and operators have seconds to react.
Where Officiating Leans on Data
Officiating is the most intensely scrutinised and carefully bounded application of high-speed data analytics. Goal-line technology, semi-automated offside systems (SAOT), and video assistant referee (VAR) review workflows all rely on identical tracking data, operating under the governing principle that machines advise while human officials decide. A tracking system may flag a potential offside infraction within seconds, yet the refereeing team confirms the outcome, adhering strictly to protocols published by governing bodies such as IFAB and FIFA. Broadcasting underlying tracking visualisations to viewers has become an essential part of the broadcast trust contract: when an audience views the limb-position skeletal frame and calibrated camera lines, disputed decisions retain public credibility. The strict requirement here is uncompromising auditability rather than raw throughput. Every automated alert demands an immutable timestamp, a data snapshot, and the specific model version that generated it, ensuring decisions remain reproducible from stored records months after the final whistle.
Sports Broadcast Analytics FAQ
How do high-speed data analytics power modern competitive sports broadcasts?
What role do sensors and wearable devices play in the ingestion chain?
Why is latency management critical for live sports broadcast graphics?
How do broadcasters utilize data analytics during officiating reviews?
Betting Markets and Integrity Watchdogs
Trading floors consume the exact same sports event streams under significantly harsher economic rules. In-play betting markets require prices to suspend the absolute instant a significant match event occurs, meaning the trading platform must ingest that event ahead of the broadcaster’s on-air graphics, or at least within a tight tolerance that risk models can absorb. This commercial asymmetry explains why operators invest in direct venue feeds and co-located infrastructure rather than relying solely on public cloud paths. Integrity monitoring functions as the mirror image: anomaly detection algorithms watch for unusual pre-match market liquidity, correlated account behaviour, and suspicious timing patterns, while organisations like the IBIA coordinate suspicious-bet reporting with sports regulators. Broadcasters navigate a delicate balance between journalism and commerce here. Official data agreements explicitly dictate how quickly odds-derived data may appear on screen, and an operator publishing probability figures without verifying rights agreements creates compliance issues that no latency optimisation can resolve.
Stadium Connectivity and Graceful Degradation
Venue connectivity remains the most vulnerable seam in the broadcast chain. Uplink bandwidth from a stadium is finite, Wi-Fi in a packed arena is notoriously unpredictable, and a single fibre cut can sever the entire telemetry pipeline. System resilience must be proactively engineered rather than assumed:
- execute capture and first-pass normalisation on-premises or at a nearby edge compute node;
- maintain a warm standby path routed over a secondary carrier or satellite link;
- cache the canonical event stream so system recovery restarts from the last confirmed event state rather than zero;
- define operational degraded modes, including a simplified fallback graphics package that renders reliably under bandwidth stress.
Cloud egress costs require realistic financial modeling, as a full season of multi-angle positional data scales rapidly. The most frequent operational failure is organisational: three separate vendors, three unaligned clocks, and no shared time authority. Tournament finals expose every vulnerability simultaneously, because broadcast load, audience scrutiny, and staffing peaks converge, leaving an unoptimised pipeline with zero operational headroom.
A Checklist Before the Next Rights Cycle
Before entering the next sports rights cycle, engineering teams must draft a rigorous data contract rather than a basic software shopping list. Explicitly specify the required sample rate, canonical event schema, timestamp authority, permitted on-air latency per output, and failover protocols if the primary feed drops; then validate each metric through synthetic data injection during a live rehearsal rather than a low-stakes friendly match. One practical habit delivers the majority of operational benefits: maintain a replay harness of a complete, high-intensity match and push it through the entire production chain weekly, exposing clock drift and schema anomalies on a quiet Tuesday afternoon instead of during a championship final. Budget adequately for cloud egress and redundant infrastructure before approving graphics upgrades. Treat every on-screen number as a sourced claim featuring a verified owner, a precise version, and a visible provenance line, because how high-speed data analytics power modern competitive sports relies far less on raw data throughput than on whether the audience and officials trust what they see on screen.